Difference between Page Speed Insights LAB data vs Real World CrUX data
Until now, Superspeed generated over +1.380.000 page speed audits for our Shopify merchants, and in this article we try to show you how lab-based monitoring and collecting real user data compare, and why Core Web Vitals are better and much more valuable than Lighthouse audits.

The LAB-based results are generated by Page Speed Insights (with Google Lighthouse), or other tools in a simulated environment (eg: bad network connection, CPU throttle, low-end mobile device and more variables). LAB-based results are more useful for developers in order to identify what page speed opportunities are available for optimization.
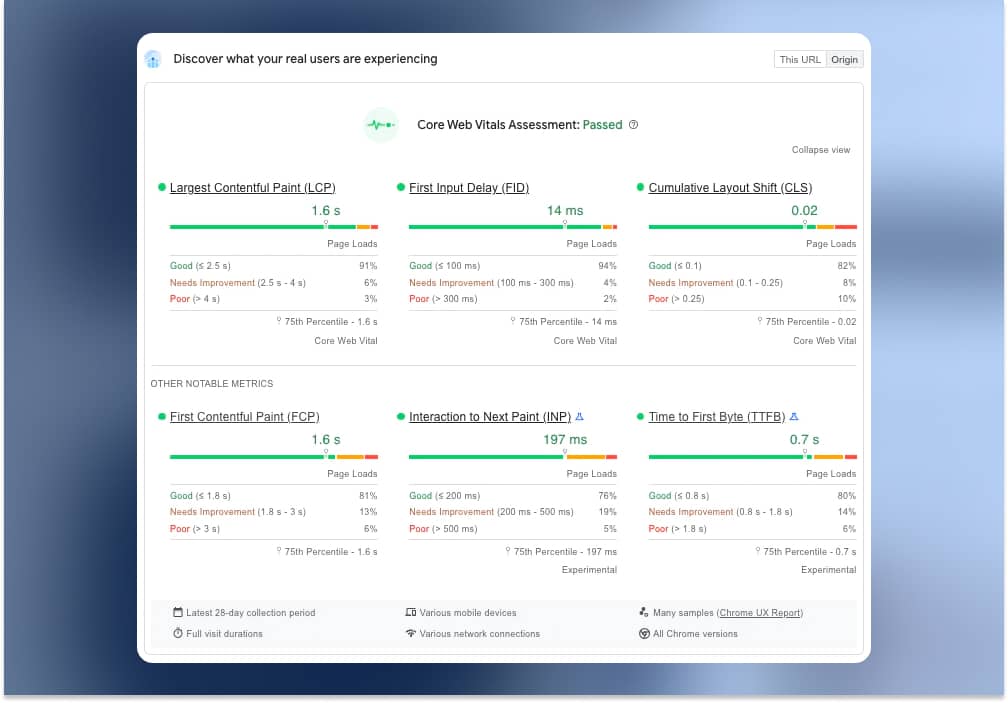
The Real User data is collected in a set of metrics (Core Web Vitals) in the browser every time a user loads a page from your Shopify store. They are collected and anonymized by the browser, and sent to Google’s CrUX (Chrome User Experience Reports) servers. They are the real values based on your real visitors, and they show us how your users are experiencing your Shopify store.
The Core Web Vitals are part of the Page Experience algorithm and they are directly related to your Search Engine rankings.
| METRIC | Good | Needs Improvement | Poor |
|---|---|---|---|
| FCP | [0, 1.8s] | (1.8s, 3s] | over 3s |
| FID (deprecated) | [0, 100ms] | (100ms, 300ms] | over 300ms |
| LCP | [0, 2.5s] | (2.5s, 4s] | over 4s |
| CLS | [0, 0.1] | (0.1, 0.25] | over 0.25 |
| INP (experimental) | [0, 200ms] | (200ms, 500ms] | over 500ms |
| TTFB (experimental) | [0, 800ms] | (800ms, 1.8s] | over 1.8s |
Is my Shopify store fast enough for my visitors?
The real-user monitoring (RUM) lets us understand and accurately determine how fast your your Shopify store is loading. They gives us a full perspective of the page experience and we can say things like: “The store is loading within 3.5 seconds for 95% of visitors”, “90% of users have a good LCP (Largest Contentful Paint) however 55% of the users are having good CLS which means the other 45% are experiencing layout instability”.
The LAB-based results testing (Page Speed Insights, Google Lighthouse, GTmetrix) will capture data in a fixed simulated environment. In 90% of the time these environments are very different from what the real visitors are experiencing.
Why Google Lighthouse results are misleading?
The only real way to understand your store speed is by having Core Web Vitals data.
Right now, for new websites Google is not showing us what your real users are experiencing because there is not enough data. They will show this data once you reach enough traffic per month (Google is not telling us how much traffic you need, but that number is in between 1k - 10k page-views/visitors).
The difference between Core Web Vitals data and Google Lighthouse results is that the Core Web Vitals data is coming from your real users, and the Google Lighthouse data is synthetic and generated in a simulated environment, and most of the time it provides misleading results.
Here is an article from Philip Walton, a Google engineer where he explains how more than 50% of the pages where the Lighthouse score is 100/100 are not passing the Core Web Vitals.
Almost half of all pages that scored 100 on Lighthouse didn’t meet the recommended Core Web Vitals thresholds. — Philip Walton
My Challenge to the Web Performance Community
Google is using the Core Web Vitals metrics to rank your website in the Google Search engine using the new Page Experience algorithm. To pass the Core Web Vitals you will need to have at least 75% users in the good threshold for all 3 metrics LCP, FID and CLS. These are the most important metrics (for now) and other web vitals metrics are FCP, INP and TTFB.
The Core Web Vitals are better and more valuable than than the LAB based results generated in Google Lighthouse because because they are coming from your real visitors. The data is collected from the latest 28-days (a full web vitals cycle) from various mobile/desktop devices, various network connections, all Chrome versions and full session durations (the new INP metric)
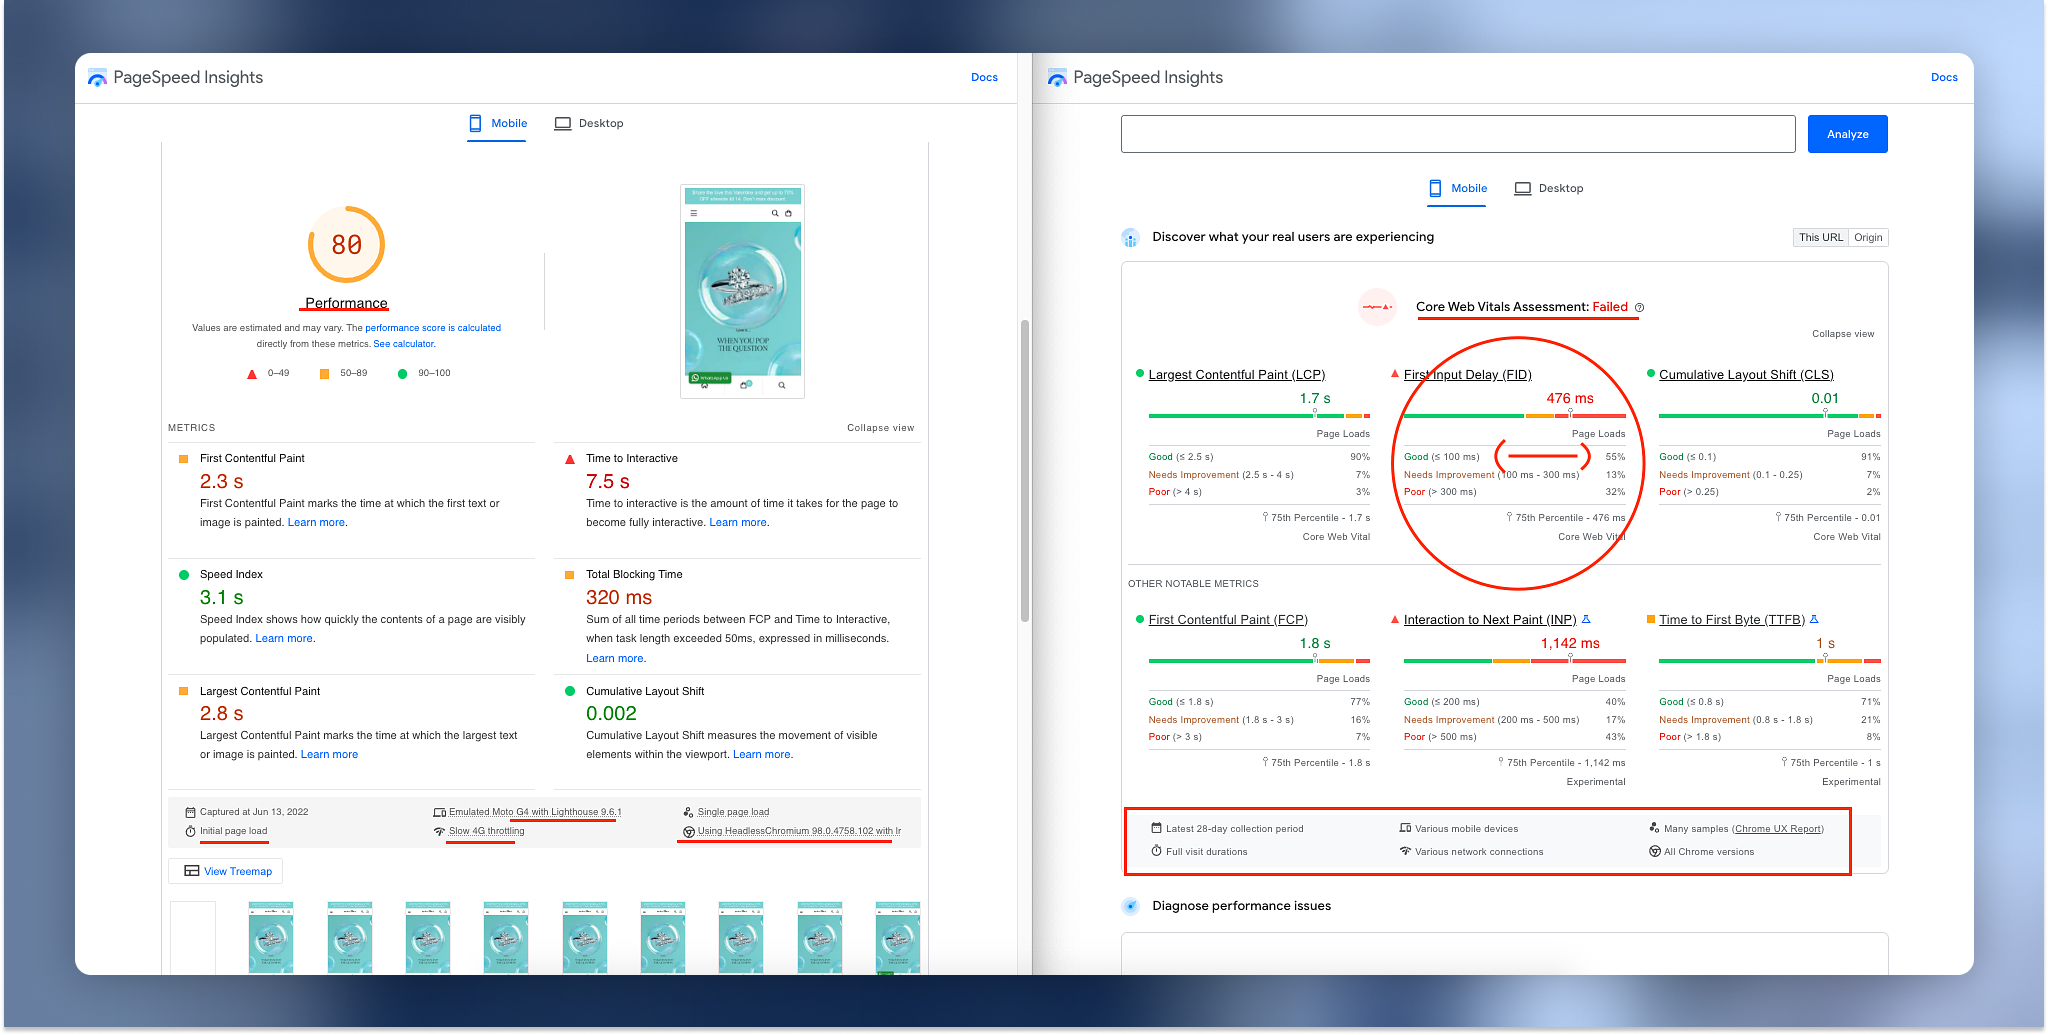
The Google Lighthouse page speed audits are generated in a simulated environment and where the CPU is throttled, the network connection is slow and is running on a single page load in a headless browser in order to catch page speed issues and they are useful for developers to know what to improve.
The Lighthouse performance score is not showing us always the reality and provides misleading results.
For example:
A Lighthouse performance score of 90/100 can still have Core Web Vitals assessment failed, and a Lighthouse performance score of 50/100 can have Core Web Vitals assessment passed. It all depends on the real-world data and how your real users are experiencing your store..
Here we might think a 80/100 is a good performance score, however the Core Web Vitals are failing because of the FID (First Input Delay) metric.
